Tables
In Morea, you can create tables using standard markdown. For example:
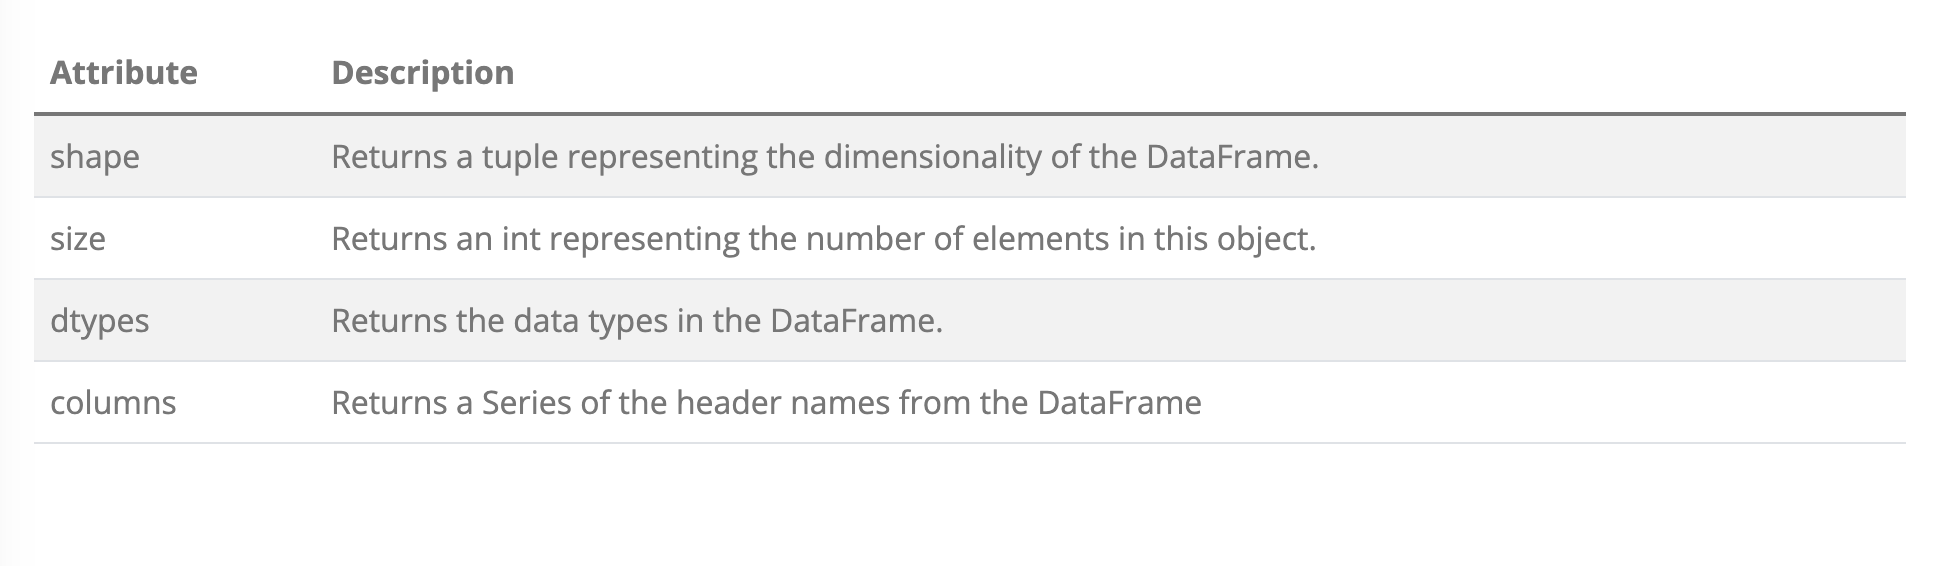
| Attribute | Description|
|:----------|------------|
| shape     | Returns a tuple representing the dimensionality of the DataFrame. |
| size      | Returns an int representing the number of elements in this object. |
| dtypes    | Returns the data types in the DataFrame. |
| columns   | Returns a Series of the header names from the DataFrame|
This produces a table, but not one that is particularly nicely formatted:
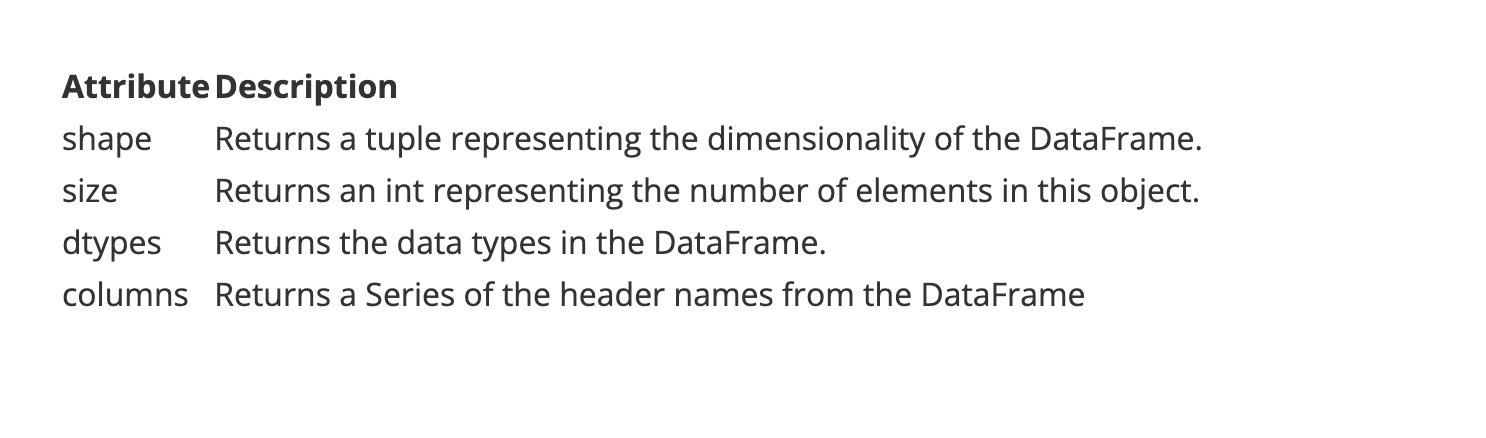
You can make the table look much nicer by adding the .table class to the HTML. This is how you do it in markdown:
| Attribute | Description|
|:----------|------------|
| shape     | Returns a tuple representing the dimensionality of the DataFrame. |
| size      | Returns an int representing the number of elements in this object. |
| dtypes    | Returns the data types in the DataFrame. |
| columns   | Returns a Series of the header names from the DataFrame|
{: .table}
Now that table looks like this:
The underlying CSS framework for Morea, Bootstrap, provides some other table formatting. You can learn about other options by reading the Bootstrap Table Documentation.
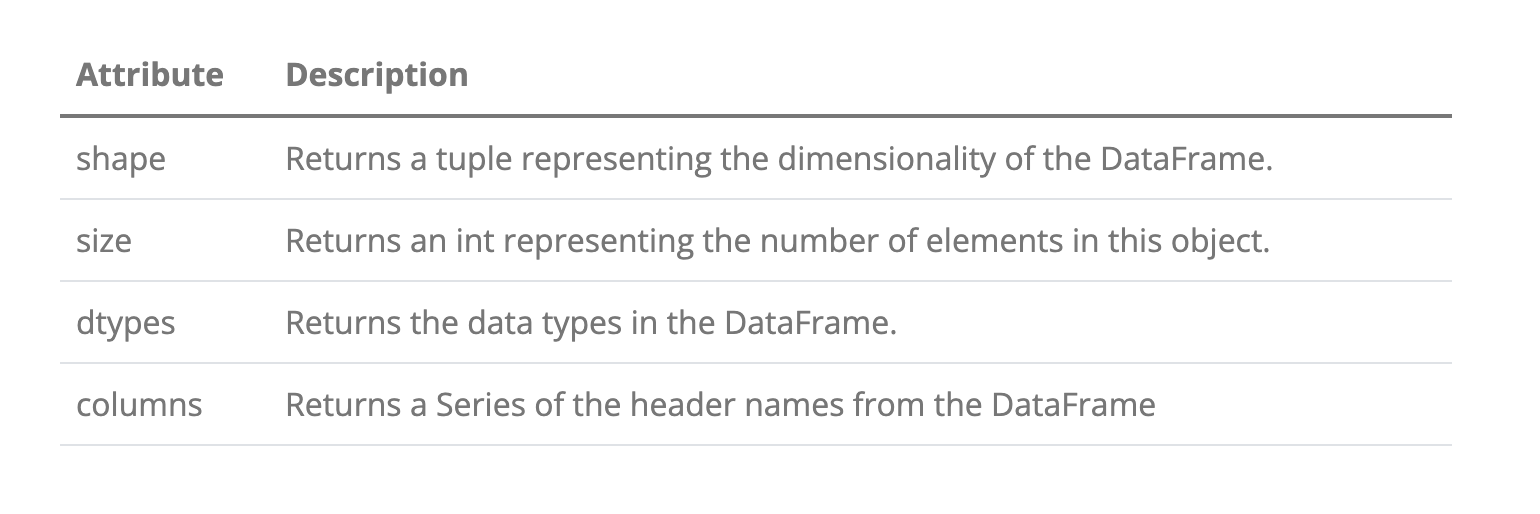
For example, here is how you could produce a striped table:
| Attribute | Description|
|:----------|------------|
| shape     | Returns a tuple representing the dimensionality of the DataFrame. |
| size      | Returns an int representing the number of elements in this object. |
| dtypes    | Returns the data types in the DataFrame. |
| columns   | Returns a Series of the header names from the DataFrame|
{: .table .table-striped}
Which looks like this: